From a marketing perspective, it would be good to start this post with something like:
Today, we present a revolutionary, fully automated solution that will allow you to analyze media trends in real time. Want to find out what people are writing about? What’s trending? Yes! You’ve come to the right place. Today is your chance to take advantage of this opportunity….
Easy…. It’s a bit like Telemango these days… it’s not appropriate 😉 So we’ll start as usual.

What is today’s post about?
We have released a new feature on the playground called Information Browser, and it does exactly what its name suggests—it allows you to browse information over time.
What is information? We understand information to be a concise thematic group of news items from websites that implicitly relate to the same situation/topic/event… What appears in the news, what the media write about, what is trending. It is what people read about on a given day/time period, only collected in one place, summarized, and named. The name of the information is not predefined in any way; it is determined on the basis of emerging news items grouped into compact information group.. The name of the information may be different every day—it depends on what is being written (and read ;-)).
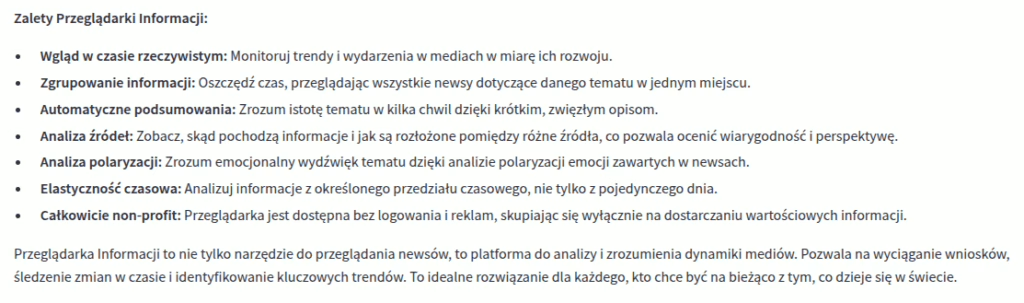
The Browser operates on the basis of information found on popular news websites, which we analyze on a regular basis and present the results of these analyses in the playground. The Browser presents the process of automatic analysis of information from these websites. It is a mechanism that presents the most important information from a given day, names this information, and writes a short summary in which you can learn in brief what the detected information is about. In addition, it will present a number of related (let’s call them) triggers for this information:
- will show the exact addresses of the websites that publish this information;
- will show the sources of information dissemination using a diagram visualizing the percentage share of a specific portal in sharing this information;
- will present an analysis of the polarization of this information (it is worth noting the correlation between the name of the information and the polarization of the information);
- use a calendar to enable tracking and analysis of information over time (although it may have a different name);
How does it work?
From a technical point of view, it is a mix of different methods and optimizations. The mechanism examines the differences between texts and, based on their similarity, selects the news items that are most similar to each other from the perspective of reduced embedding for one information group. The mechanism for separating information clusters adjusts its operation to the amount of data it analyzes. There are days when there are about 600 news items, but there are also days when there are twice as many. Based on multiple distributions, the mechanism selects the one that best fits the additional conditions for data division, e.g., it does not allow divisions below 5 information groups or above 60, and additionally takes into account the golden mean, i.e., targeting 20 topics per day, while optimizing the number of rejected examples. From the perspective of the two months reviewed, the media most often publishes between 20 and 30 pieces of information per day.
For whom: “as different as chalk and cheese”
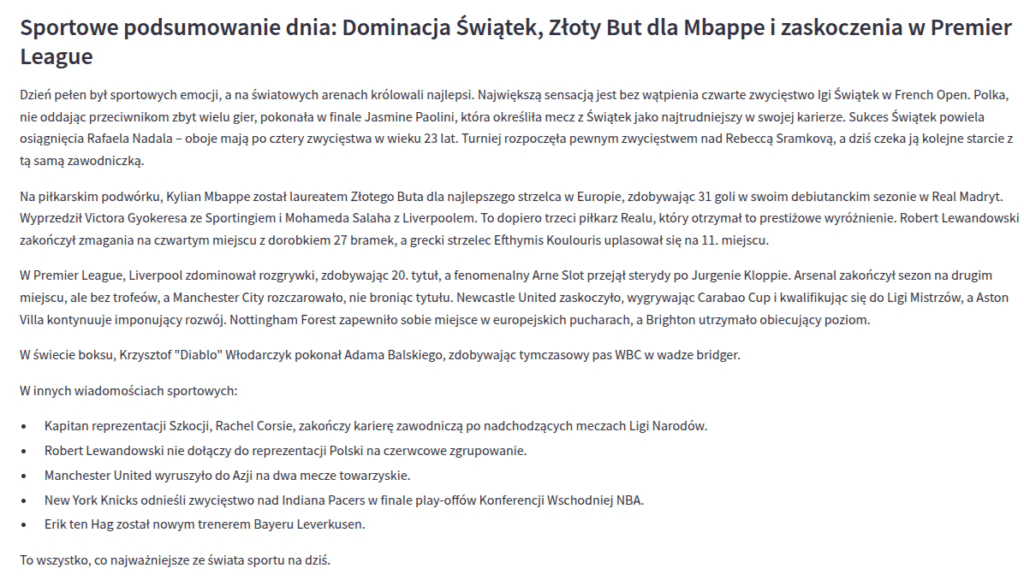
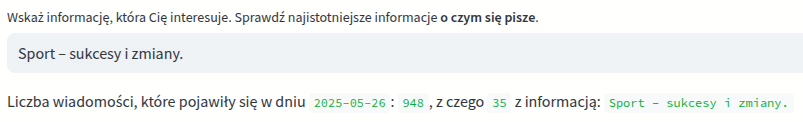
You could say: For everyone… From the perspective of someone looking for specific information, this solution allows them to access dozens or hundreds of news items from a specific day with specific information in one place. If someone is interested in sporting events and there is a lot of information about sporting events on a given day, they will receive a summary of many events (including those from foreign sources). For example, suggestion number 1 (number 0 appears by default) on May 26, 2025, shows the information “Sports – successes and changes.”, whose summary looks like this (click to enlarge):
In addition, we receive addresses of related pages with information containing this description:
Kliknij aby zobaczyć zdjęcie
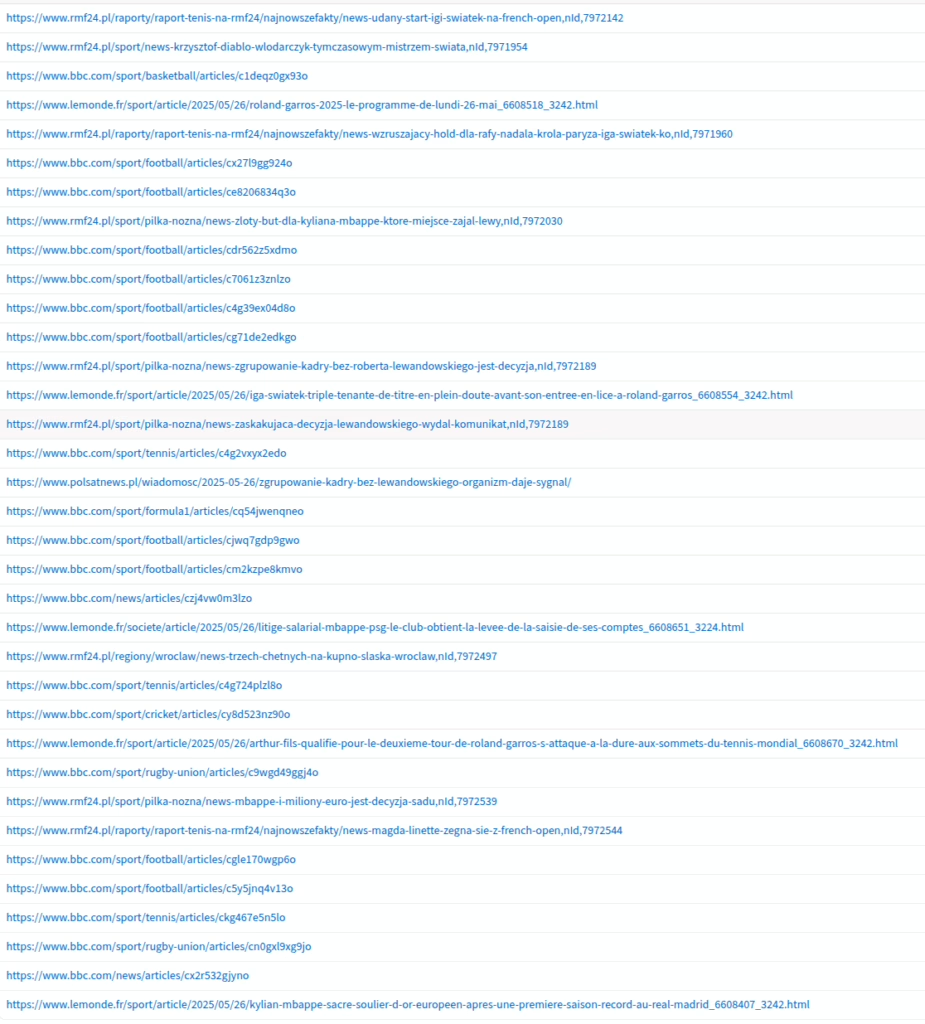
From an analyst’s perspective, linking information about sources of propagation, i.e., the graph:
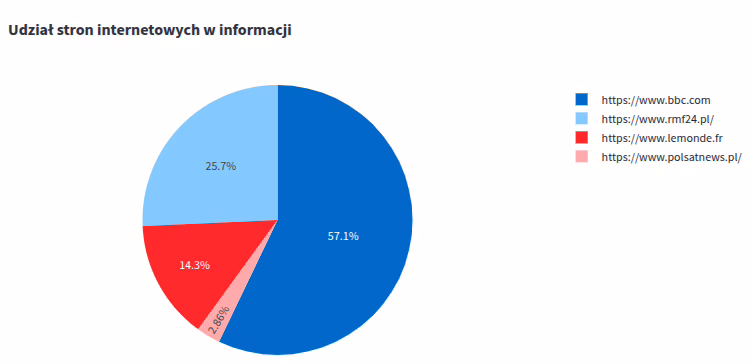
The graph shows where the information comes from and how much it is dominated by a single data source. And while in the case of sports, this may be a less important variable, in information related to, for example, politics or modern technologies, the distribution of the origin of the pages may show the process of introducing information into circulation. Analyzing this information over time using a calendar allows you to track it and draw conclusions. It is important to remember that information is named individually on a daily basis, so names may vary depending on the day. Therefore, human interaction is (still) required to track specific information over time 😉 In addition, we receive a summary of the distribution of emotional polarization in the form of a diagram:
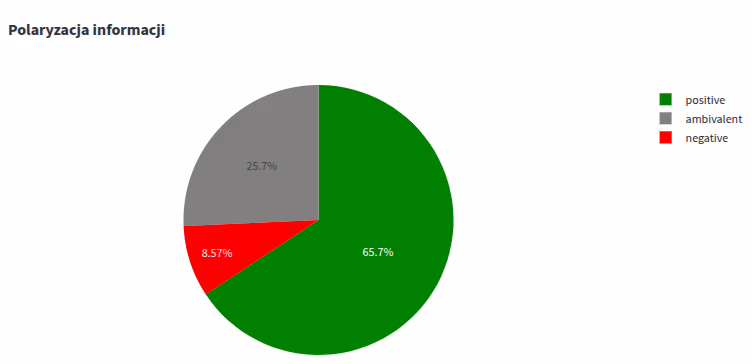
When analyzing such a diagram, it is worth paying attention to the correlation between the name of the information and the polarization/tone of the text (positive, negative, ambivalent-neutral information). The name of the category clearly indicates what the polarization distribution may look like. Our model, which has been operating on the playground for a very long time and is used to evaluate texts in real time, is responsible for detecting polarization. Based on the decisions of this model, the share of a specific tone in a particular piece of information is presented (this is not the tone of the summary article, but of the news items containing the information). In addition, we obtain accurate data on the number of news items:
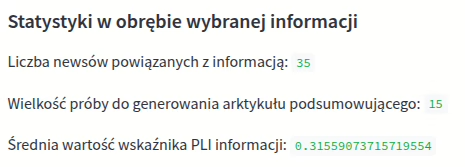
And linking the number of news items in the information with the number of news items throughout the day (and this variable is accessible):
allows you to determine the relevance of information in the context of the entire day…. The rest can be left to the imagination 😉
Outro
Why only one day? No problem, the mechanism works based on time intervals, analyzing information from the specified interval, not for the specified day. The mechanism itself is universal, and for analyses covering more than a week, it requires slightly more powerful hardware (and, surprisingly, it is RAM and a processor, not a GPU :)), the analysis of about a thousand news items from a given day takes 15 to 28 minutes, so not that long. We are currently analyzing days up to January 1, 2025. After this process, it will be possible to track information from January 1, 2025, to the day on which it will be tracked. The mechanism works on the basis of automated one-day analyses, which is why a summary of the previous day’s information appears every day. After the one-day analysis, we plan to introduce weekly analyses.
We encourage you to browse the Information browser, analyze it, and draw conclusions. The browser is, of course, entirely non-profit, without ads or logging in 😉
Interesting fact
Content Supervisor about Browser [click]
Summary of this post using the content supervisor from Public Chat 😉 Here’s what gemma wrote about the Browser:
Conversation available to read in Public Chat, just load the hash:
7ivUpPCTNPR0d8gGbPT9hh5nD1Y8yMapJSOISOTg7mFJvryf3BgzGdT03Bsf0Ui3gWymAkciIWRxPJnHslFwnP0FtYzrSi8xj7AOqxT5lcqQ1waaYadNUIOoOJAqu9wP
Pingback: Eksplorator Informacji – nie młotek, a skalpel – RadLab